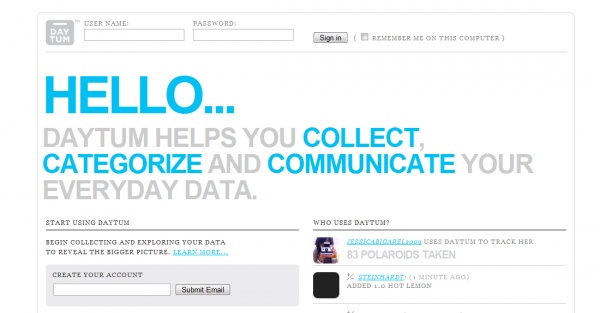
This week’s Interfacing features Daytum, a nifty website you can use to process and organize any information you may have. Once you create an account, you can start creating categories and logging information in that category. Keep track of things like lunch frequency, time spent asleep, or any other things you want to keep a track of. You can then use Daytum to generate charts or other graphical representations of the date that you’ve put in, which will be compiled on an individual user page. All told, Daytum has created a brilliant way to organize and communicate the data in your life in a clean, graphically pleasing way.

Leave a Reply